US September 11% Drop in Import Volume Reflects Post-Tariff Reality
Total
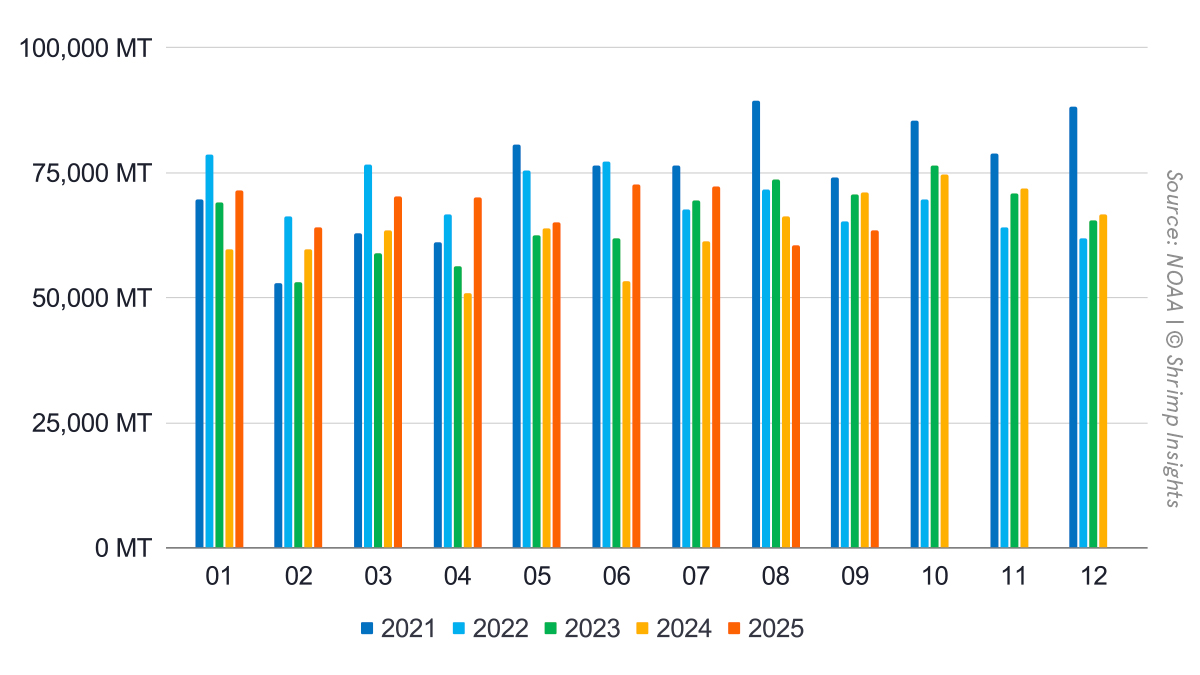
US shrimp imports closed the first nine months of the year at 610,041 MT, up 11% year-on-year. Growth was broad-based and robust in the first half, with monthly volumes expanding at double-digit rates from January through July, peaking in April (+38%) and June (+36%). This positive trend was interrupted in late summer by the reciprocal tariffs taking effect. August volumes declined 9% year-on-year, followed by a deeper 11% contraction in September, marking a clear break from the pre-tariff strong first-half momentum.
In value terms, performance remained stronger than volume. Total import value reached USD 5.07 billion year-to-date, up 18% year-on-year. January through July all posted double-digit growth, with robust gains in April and June (both +47%). As with volumes, momentum weakened in August and September, when values fell 6% and 8% year-on-year, respectively, reflecting lower volumes and easing prices.
Products
Peeled frozen shrimp continued to dominate the US import basket and drove much of the year’s growth. Imports reached 318,625 MT in January–September, up 15% year-on-year. Volumes expanded strongly through July, with growth peaking in June at +46%, before turning negative in August (-6%) and September (-12%).
Shell-on frozen shrimp showed a much flatter trend. Year-to-date volumes reached 151,396 MT, up just 2% year-on-year. While April (+52%) and June (+20%) stood out as strong months, most other months hovered around or below last year’s levels, and late-summer volumes again weakened.
Value-added categories continued to outperform raw formats. Cooked and marinated shrimp reached 90,532 MT year-to-date, up 16% year-on-year, with solid growth through June followed by declines in August and September. Breaded shrimp volumes totaled 44,198 MT, up 3% year-on-year. After a strong March and June, imports in this category also lost momentum in the third quarter, with double-digit declines in August and September.
Top Five Origins
For India, January–September volumes reached 245,476 MT, despite a year-on-year decline in September still up 15% year-on-year. Growth was robust in the first half, with the most substantial gains in January (+55%) and June (+44%). Momentum slowed later in the year, with August volumes barely above last year and September falling 11% year-on-year.
Ecuador continued its steady expansion in the US market, shipping 166,133 MT in the first nine months, up 16% year over year. April stood out with a doubling of volumes (+102%), while growth remained positive in most subsequent months, including a strong September (+22%), making Ecuador one of the few major origins still accelerating late in the period. Of course, this relates to Ecuador’s favorable position on reciprocal tariffs.
Indonesia posted more modest growth. Year-to-date volumes reached 99,562 MT, up 6% year over year. Substantial gains in March, April, and June were offset by sharp declines in August (-23%) and September (-31%), eroding much of the earlier momentum. This drop is primarily due to the Cesium-134 situation, which persists to date. A review of BL data for Indonesia’s shipments to the US suggests that October and November imports may drop by 75-85%.
Vietnam continued to lose ground in the US market. Imports declined 9% year-on-year to 43,281 MT in January–September. After a strong January and a spike in June (+52%), volumes dropped sharply in the third quarter, with August and September down 46% and 35% respectively.
Thailand showed limited but positive growth overall. Year-to-date volumes reached 18,155 MT, up 7% year over year. Early-year growth was solid, but volumes weakened noticeably from July onwards, culminating in a 34% year-on-year decline in September.
From Shrimp Insight
More Related Articles